
Mapping without GIS
Introduction
Top tier software for any discipline is expensive. There are a few software houses that seem to compete successfully by creating “just about as good” software for those who can’t or won’t pay the crazy prices. While the defacto standard products require a subscription-based payment, the little guys offer purchase-once prices. If you don’t like paying at all, there is FOSS.
It was that way in the ’90s and it’s maybe even more so today. I think a few factors that contribute to this are:
- computers are very powerful today, lots of memory, lots of storage
- graphics are very good, both displays and printing
- programming languages, libraries, and development tools give a small team the ability to turn out great software
- there are a lot of software developers that collaborate on community projects
But even commercial software can be a good thing. Smaller companies can keep the price of good software low in order to attract the majority of customers - until they are offered too good a deal and sell to their competitors, of course.
Why am I talking about this? I got my first big break in geophysics by knowing how to program in Fortran. After graduating, I lacked having a Fortran compiler that would work on a PC of the day. A few years later I discovered Salford Fortran - they still exist today, and for those of you who think Fortran is dead, 😲, take a look at their site. The free version is a fully functioning Fortran95 compiler and comes with all the same extras as the paid version. However, it only runs on Windows and compiles for Windows. The free version compiles an annoying pause at the beginning of every user program. It didn’t do that with their Fortran77 version.
Along with the Fortran compiler, I found another great little application called Surfer by Golden Software. Their software was never free, but for what it is capable of, it was pretty cheap, somewhere around \$400US in 1997. The current price for a one-time purchase per user copy is a whopping \$1449US, plus an optional annual upgrade cost of \$261US. Or, you can opt for the subscription pricing of \$599US/yr which is cheaper after about 3 years. This is sounding like a product endorsement/ad but I’m not affiliated with them in any way. I just like their software, and it’s been getting better and better every year. They are what I call a “small guy” in a much larger “GIS sea”. What are you getting into with the big guys - like Esri Canada. Their product is ArcGIS Pro and it only has subscription-based pricing. The lowest package is \$1450CAD/yr, the next level is \$5790CAD/yr, and higher. This is all for just one user. They also have a version called ArcGIS for Personal/Student Use (non-commercial use) for \$175CAD/yr. Your mileage my vary depending on what you need from the package.
I know there are a lot of Open Source GIS projects out there but I have no experience using any of them. It’s easy to Google them. If you find something that works for you, that’s great, that’s what I did. Also, I have to say, that the GIS community is large and shares a lot of useful information. If you have a problem you can’t solve, they will likely have an answer. All of the software I use and reference from here on will be my own or from a list of low-cost apps that most people can afford. Knowing a small package well, is usually better than knowing very little about a huge package.
Finding a base map for my project
Goverments have been providing elevation contour / topo maps of their respective countries for a long time - either printed or in digital form more recently. Canada is no exception, and while they keep changing their website to make it more confusing with each year that passes, you can still get topo maps for use as base maps for your project.
The Canadian system of mapping is called the National Topographic System, NTS. It’s a gridding system that covers the entire landmass of Canada.

The larger grid cells (NTS 83, for example) are mapped at a scale of 1:250,000. Each of these maps is subdivided into 16 cells, labelled A thru P (NTS 83-B, for example) at a scale of 1:100,000. Each of these is subdivided into a further 16 cells labelled 1 thru 16 (NTS 83-B/7, Rocky Mountain House). Each of these map sizes have boundaries that follow that latitude and longitude system. If you know your area of interest in geographic units, then you can use this index map to locate the sheets you need to download.

Example Project - Gravity Survey over Vulcan, Alberta
Project:
- Location - Vulcan, Alberta
- Objective - regional gravity survey, detailed grid, specific lines
- Tasks:
- Determine geographic bounds of project
- Acquire NTS base maps
- Prepare image file for use
- Straighten Map
- Georeference
- Crop to the project area
- Create an engineering drawing base map using the image
- Using Google Maps, I looked up Vulcan AB. The centre of town is located at $50.402100465N, -113.269215018W$. The project will be roughly 12km wide by 8km high, centred on Vulcan. Hopefully, this involves only one map. Using the index map I know that Vulcan is going to land in Map 82-I/6.

-
There is an FTP site where all image maps are available. They are basically a scanned image of the paper maps. The ftp site is here. I navigate to the site and drill down to the …50k/082/i/06 directory. There are 3 zipped files: a tiff, a pdf, and a geotiff. They are all basically the same but if your particular mapping software can use the geotiff metadata then this may be the best version to use. I’ll use the tiff file, so I click on it and it downloads to my Downloads folder. The file is 11.6 Mb in size and the zipping didn’t shrink the image much but included a second file that we won’t use.
-
Before we can use it in any meaningful way, we need to convert the default coordinate system from pixels to real world units of meters. These NTS maps use the UTM projection system and the datum can be either NAD27 or NAD83. This FTP site appears to hold the NAD27 versions. These maps can be dated. This one is dated 1975, so culture (objects like buildings, roads, bridges, etc) built after this will not appear on the map.
You will notice that the blue grid lines are not horizontal and vertical. This is the UTM grid and I need to straighten the grid lines to match the typical xy grid axes for plotting data. I do this by rotating the grid. There will be some distortion due to the UTM projection itself and how far it is in an E-W direction from the central meridian, which is located at UTMX = 500,000m. I will cover map projections and UTM in particular in a later post.
I will use a program called Affinity Photo to load the tiff file and straighten the grid lines. I choose a horizontal grid line in the middle as a reference to minimize the bias from top to bottom. The straighten tool wants me to draw a line by selecting two points on the image. For normal photo editing you might choose the ocean horizon or some other object you know should be horizontal.

The next step is to crop the image to the area I need. I use the blue grid again, and crop to a region 12km by 8km with the town of Vulcan in the centre.

- Now using this famous Surfer program, I can finish the remaining steps. Apart from the frame and the title boxes, the main item is the map object. When I load an image it is given axes limits equal to the min and max pixels in the image. The units are effectively pixels, not meters. However, the data limits can be changed from pixels to anything really, so lets use the real world units by scaling the image to the correct UTM coordinates. I won’t cover every detail here, but if you look at the following spreadsheet screenshot, you can see that I entered the image size in pixels, then I digitized a UTM grid intersection point in the lower left and upper right corners of the image and entered those data. That’s all the input I need. The calculations determine the image’s actual size in meters.

These coordinates are transferred to the map object as the data limits. And presto-chango, we are in the real world. A little scaling to fit the page and I’m done. I can now print the drawing directly or save it as a PDF file or an image file.

Summary
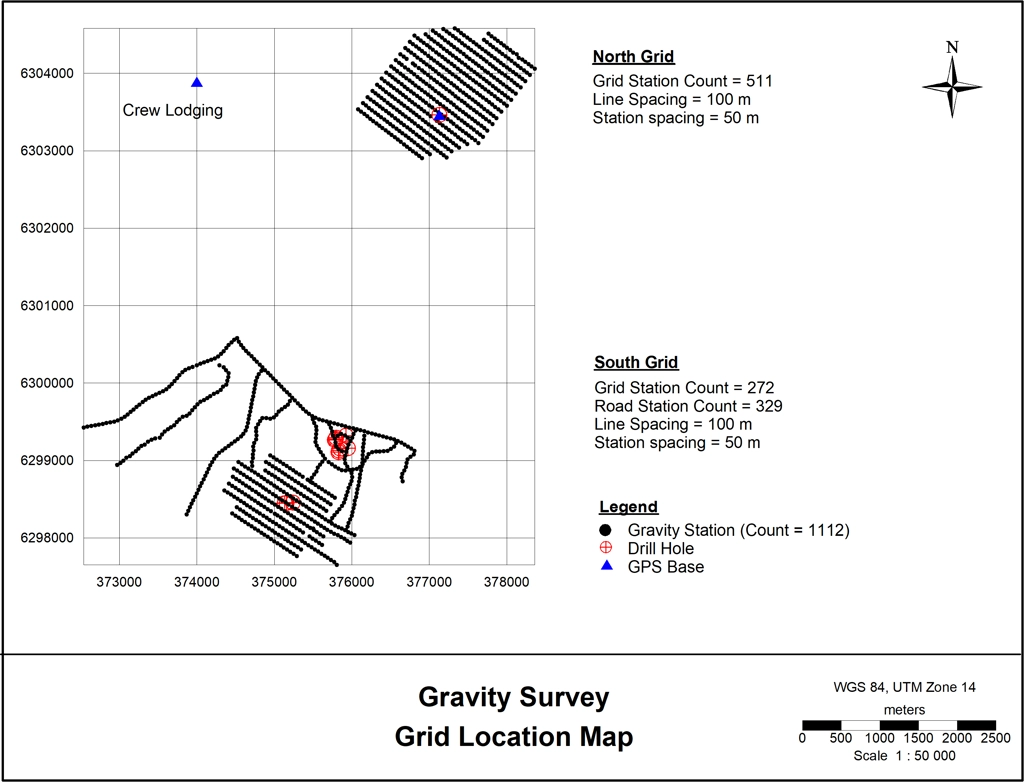
I have shown you that with a few inexpensive tools and your own programming abilities you can generate a pretty impressive product. Starting with the base map, I can now add layers of other information like grid-formatted stations, boundary lines, line-formatted stations, base station locations, anything you wish to plot because the map is in UTM Zone 11 coordinates.
If you can do all this, then do you need the expensive stuff? Well, my experience tells me that GIS operators are not necessarily equiped to convert coordinates or write their own programs to do many basic data conversion processes from scratch. The expensive GIS packages will have all these conveniences built in but you have to buy them, learn how they work, and then buy them again month after month. It’s convenient. You pay a lot for what you can’t do yourself.
I will use this base map I’ve produced in future posts and add station layouts along polylines, grids, and then select from datasets those points that fall inside or outside of a polgonal area including holes (or islands). Stay tuned.